Table of Contents
Here’s the quick start guide on how to acquire data with DacqMan running the RS104 (IS-Target, Low Energy) UT Scanner. This guide here includes just the basic steps. Really, just a few clicks to start your scan runs.
NOTE: You may use a customized version of DacqMan. Data formats, sequence of operations, what the screen looks like – all of those might be different. A version of DacqMan that is running on your computer might not include the customizations that you need.
Quick Summary
FOLLOW YOUR SAFETY PROTOCOL AND THEN WHEN READY:
- Start DacqMan
- CONNECT to the ports
- Select your data output directory
- START the data stream
- Adjust transmit/receive gains and maybe receive delay
- STOP when you’re done
Quick Troubleshooting
If the waveforms stop their one-second yellow flashes and file progress stops, try STOP and then START again (these early versions of DacqMan might sticklers about bit errors)
STOP and Reload DacqMan
Click the red bar at the top “(click to reload this App)” or use Ctrl-R (Windows/Linux) or Cmd-R (Mac) to Reload Dacqman
Close DacqMan and re-start it
The steps in a little more detail:
Step 1: Before You Start: Make sure to follow your safety sequence protocol first!
Step 2: Things That Are Already Set Up
- hardware and PC setup are already done and tested prior to deployment
- version of DacqMan (customized or stock) installed on the PC works for your situation
- After your safety protocol, the hardware is now deployed, powered up, and the USB adapter is plugged into your PC
Step 3: Double-Click the Desktop Shortcut or “DacqMan.exe” in the correct directory to start DacqMan
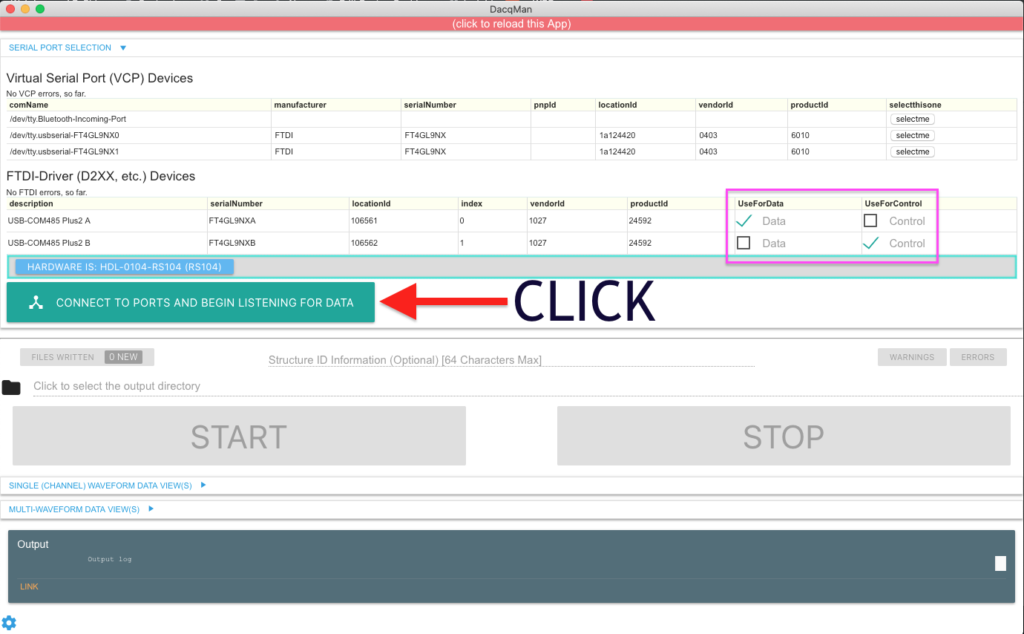
Step 4: Click “CONNECT TO PORTS AND BEGIN LISTENING FOR DATA”
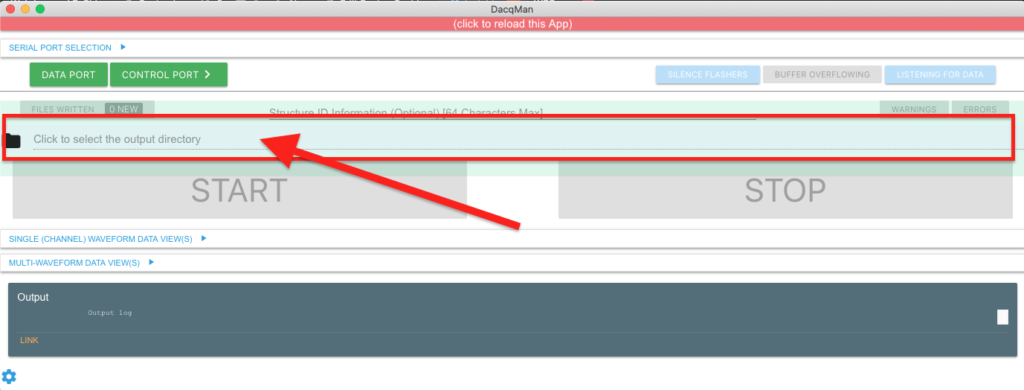
Step 5: “Click to select the output directory” + “Start Capture to this Directory”
Click anywhere in the area (shown in Figure 4.2 above) near the folder icon to select the directory where the files from the streaming data will be auto-saved.
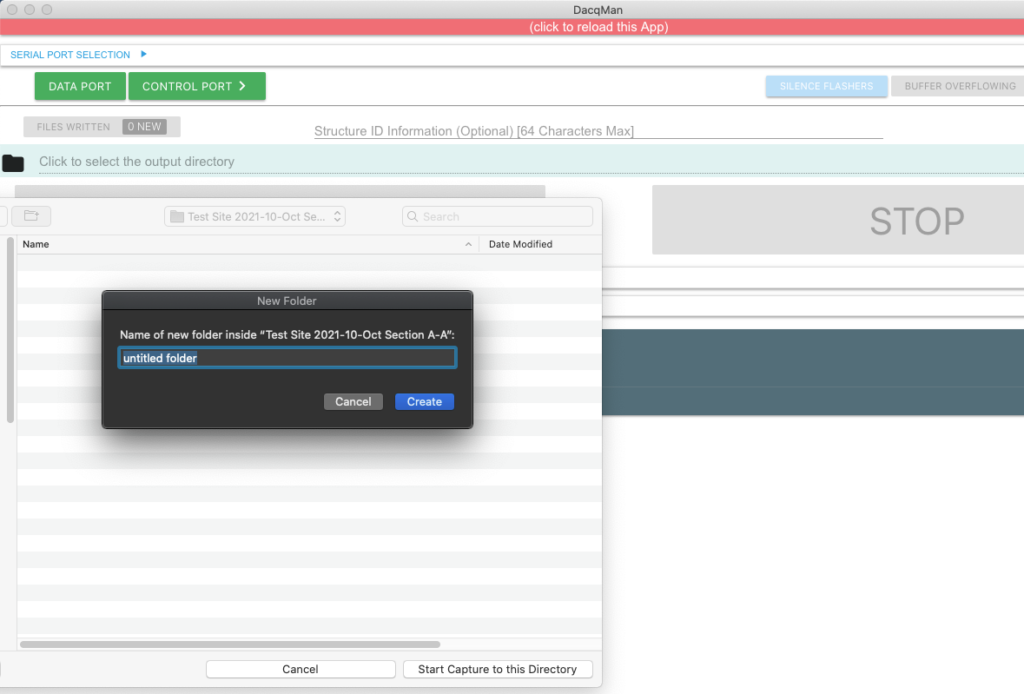
Use a directory location per your organization’s naming conventions.
Don’t use an active cloud-based location, unless you’ve tested this before.
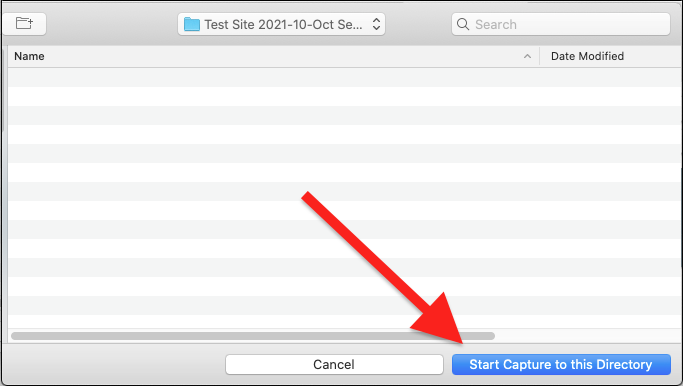
Click “Start Capture to this Directory” when you’ve created or selected the right location.
After selecting your directory, the full path to this directory should show up next to that directory icon in the DacqMan window where you clicked to set the directory.
Step 6: (Optional) Enter “Structure ID Information”
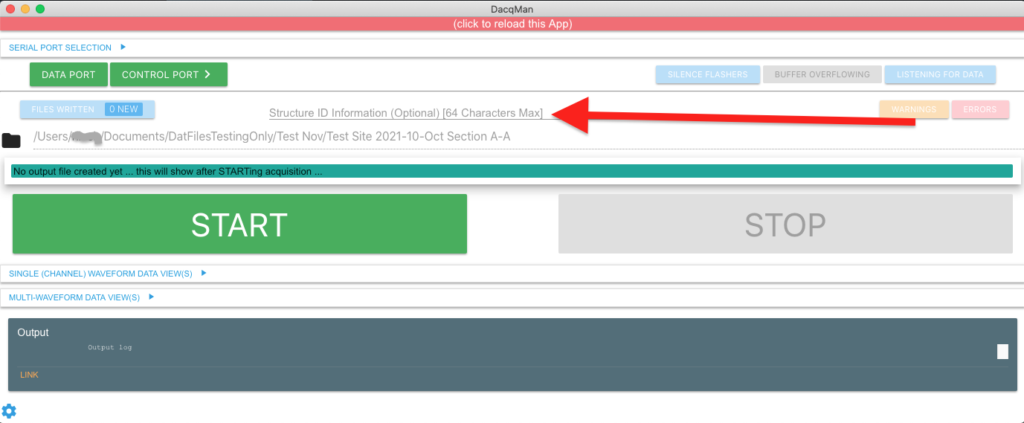
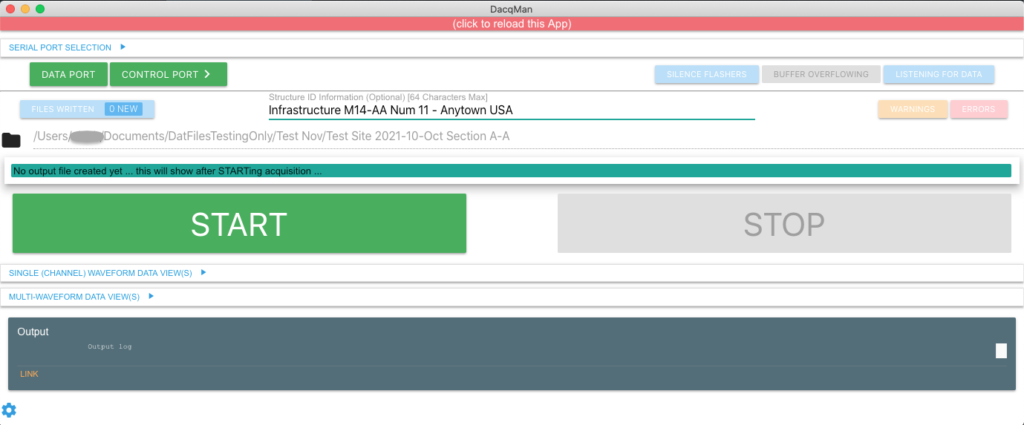
Step 7: “START” [Big Green Button] (or maybe Step 8 is first for you)
This is to your taste and protocol. I like to click START first so that when I change Transmit (Tx) voltage (gain) and Receive (Rx) gain and delay (if necessary), I can see the changes in the waveforms real time.
But, maybe, your preference or required protocol says that you set those first (see Step 8), and then click “START”.
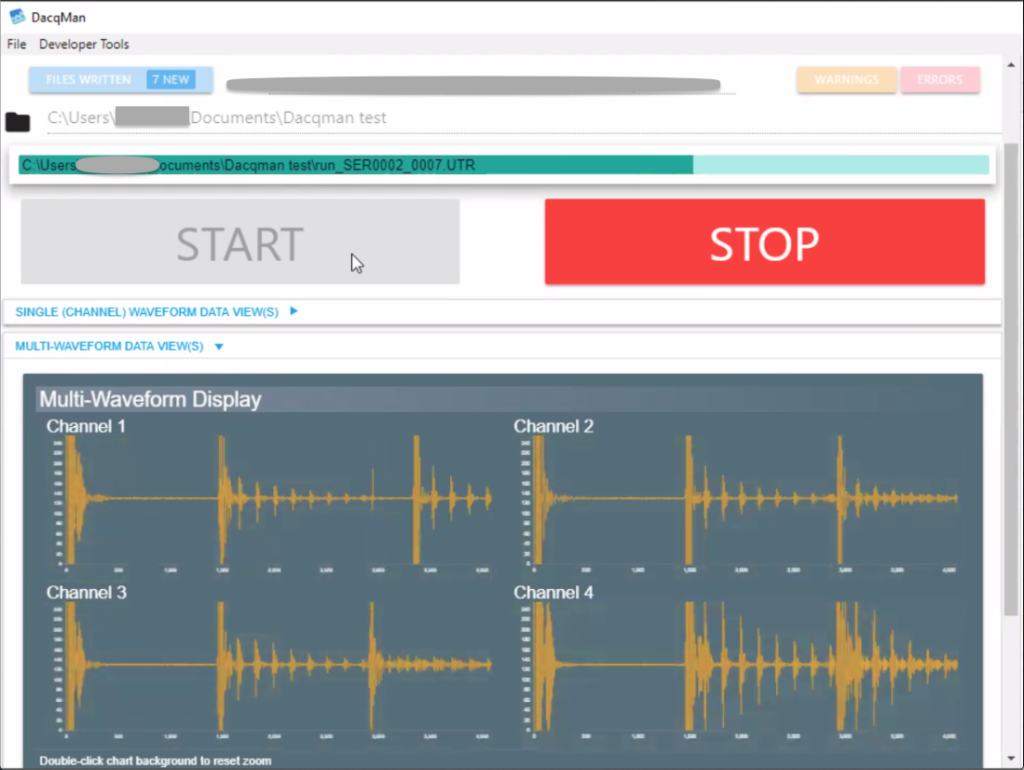
Look at progress indicators and graph updates (see caption for Figure 7.1).
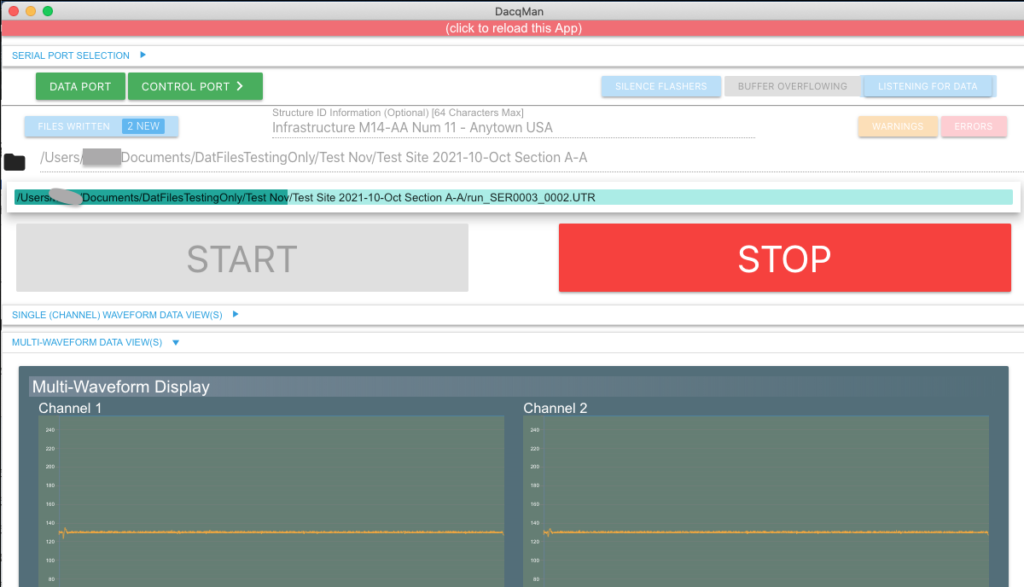
Step 8: Adjust Gains and Delay (or do this first and then Step 7: START)
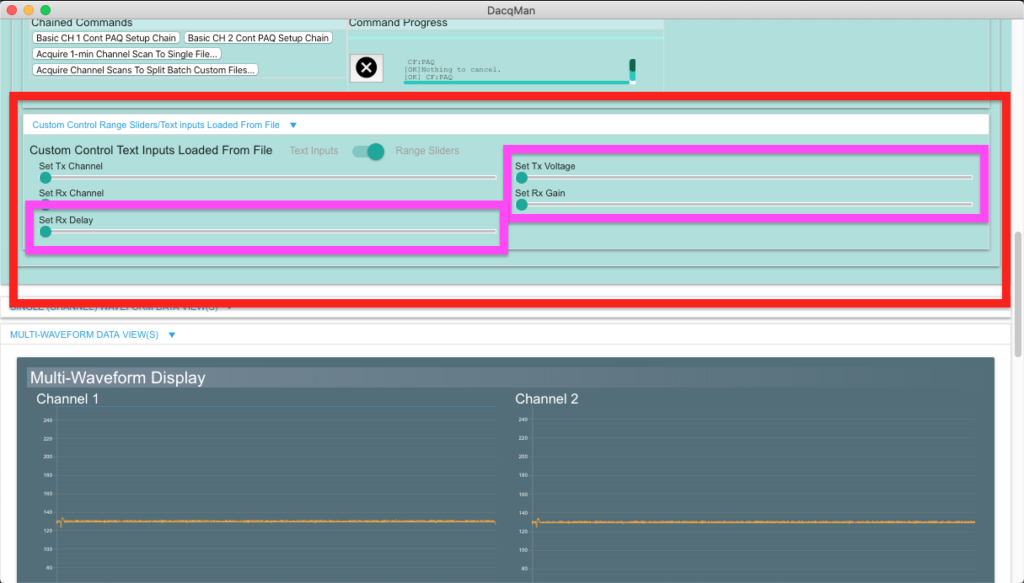
Click “CONTROL PORT >” [GREEN] to expand (or later collapse) the Tx/Rx control sliders section.
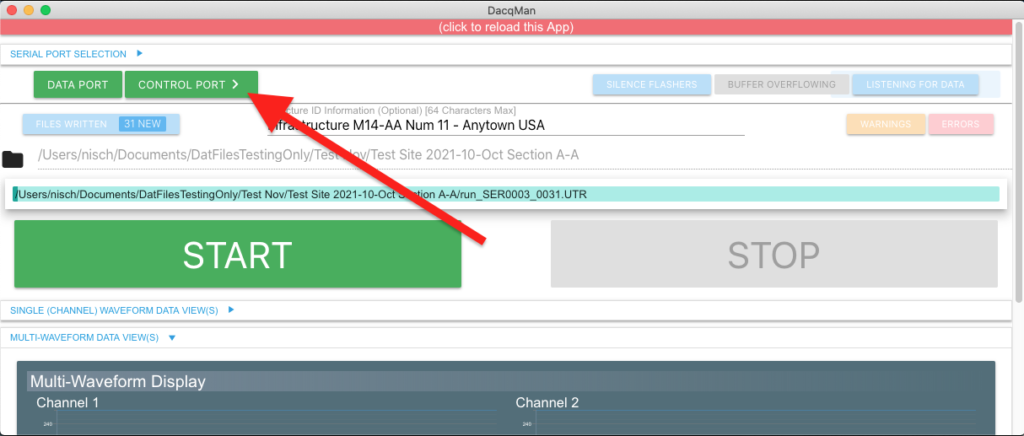
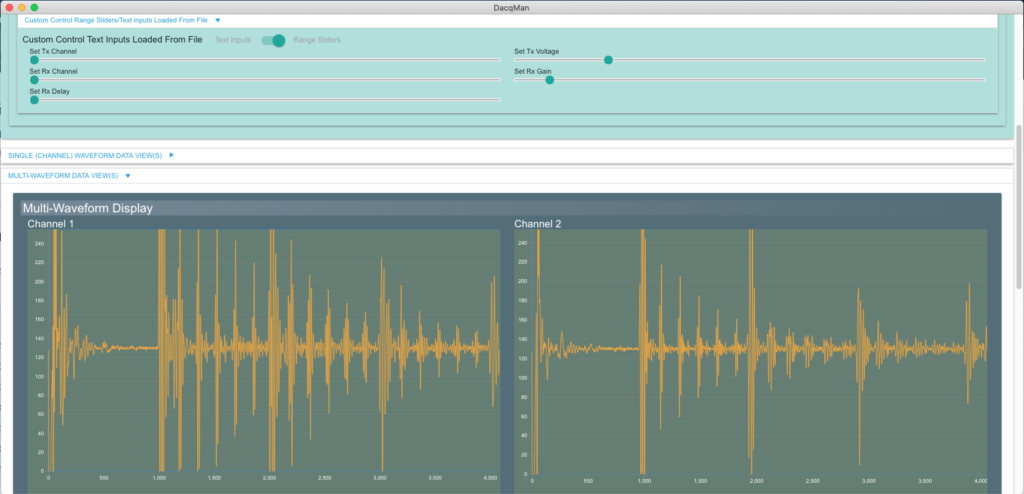
Scroll down to the Control Sliders Section, just above the waveform graphs. Use the sliders to adjust the settings. USE ONLY the right hand side “Set Tx Voltage” and “Set Rx Gain” and maybe if you need it the “Set Rx Delay” at the bottom left of the slider section.
Click the green circle of the slider, move it where you want, watch the number the pops up above the circle when you slide. The new value is sent to the RS104 when you release the mouse button after sliding.
When you’re done, you can collapse the CONTROL PORT section again if you want to so you just see the file progress and waveforms. Just scroll to the top and click “CONTROL PORT” again to collapse that section.
Typical values seem to be as below these days – BUT – watch your waveforms too for what you need, or use your standard protocol:
- Set Tx Voltage: around 6 or 8? Higher is generally fine. Check with the pre-deployment testers or supervisors. This values is different compared with the DLITE-0100A1 series and can be set much higher.
- Set Rx Gain: around 4 – 8?
- Set Rx Delay: there are only 4 positions on this slider, separated by a lot on the scale, so you might leave it at default (0, all the way to the left) or set it to 1 – watch your waveforms. This relates to the distance of the transducer face from the target surface you are scanning.
